ON MONDAY, narrowboatworld revealed that C&RT had posted 29 stoppages in April. Now Allan Richards provides more stoppage information for April stoppages taken from the Trust's database:
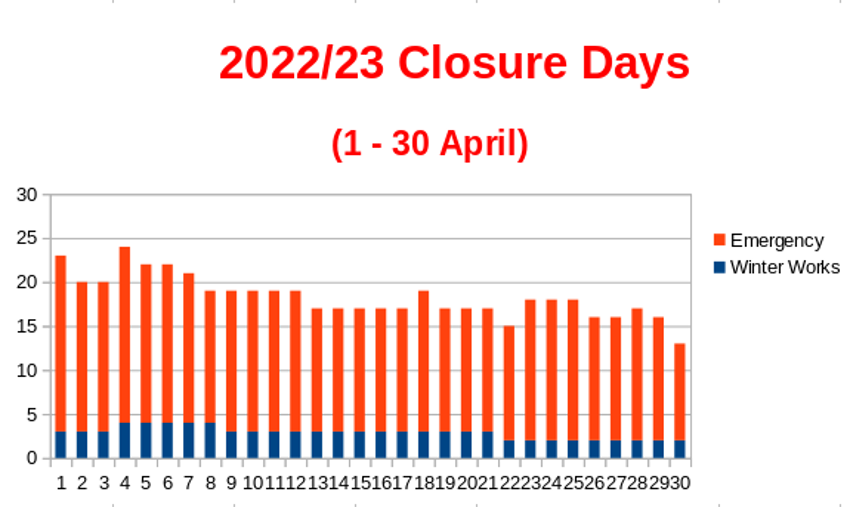
Closure days
Unfortunately, the grant agreement does not require the trust to publish the same information for navigation closures. This might give some understanding to the relative priorities of both Defra and C&RT regarding boating vs. towpath users.
In April 2022, C&RT's waterways suffered 549 closure days. That's more navigation closure days in one month than towpath closure days in the previous 12 months!
On average, we had the network closed in 18 places each day in April.
The number of closures each day can be found in the following graph:
Downward trend
Thankfully, over the month the situation has improved somewhat with two overrunning winter works projects finally completed and C&RT fixing emergency stoppages faster than new ones have been emerging. To better understand trends the following graph shows the average closure days on a weekly moving average basis. As can be seen, over the month the average number of stoppages per day has fallen from about 21 to about 16.
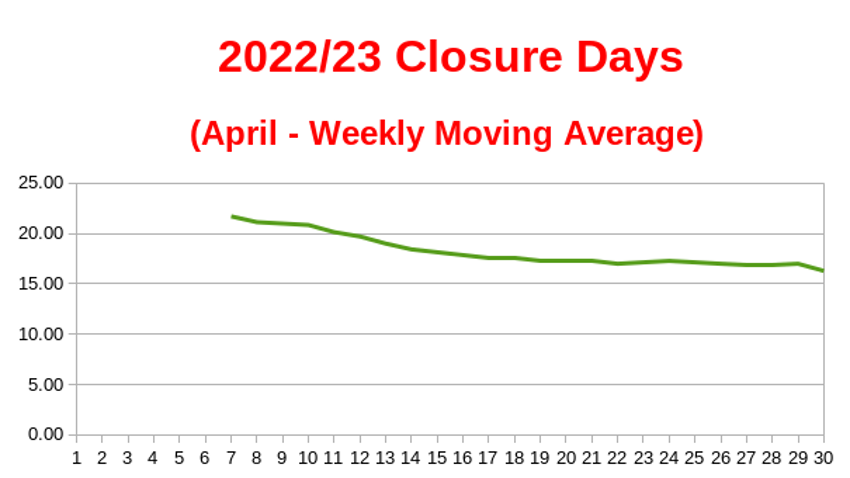
(For anyone unfamiliar with 'weekly moving average' also known as 'seven day moving average'—the green line plots the average closure days by including the preceding six days. So for the 7th April it averages closures between 1st and 7th April, for the 8th April it averages closures between 2nd and 8th April and so on. This smooths out daily figures (as given in the first chart) giving a better picture of longer term trends.)
Elbow bump
Perhaps, C&RT deserves a cautious 'elbow bump'. Perhaps not as 16 is still higher than what we were seeing last year which was around 14 stoppages each day.
... and 16 is double what we were experiencing in 2012 which was around 8.