FOLLOWING a disastrous 2018/19 year, Canal & River Trust has not set itself targets for its current year.
Allan Richards explains how the Trust measures its success and progress against Key Performance Indicators (KPI) but has now scrapped them after missing almost half its targets.
What are KPI’s?
See: http://allanrichards.net/CaRT/KPITargets2018-19.pdf
For many years CaRT has measured its success by its performance against key indicators. Yearly targets are set by chief executive, Richard Parry, and agreed by the board. Progress towards KPI targets is presented at bi-monthly board meetings. A traffic light system is used such that the board can quickly identify where progress towards target falls short of what is expected:
Green—on track to achieve full year target
Yellow—risk that full year target may not be achieved
Red—unlikely that full year target will be achieved/full year will not be achieved
KPI reports now include how long a KPI has been red or green and the person or document providing the KPI figure. For example, “WEM report” is what most boaters would know as the rolling monthly survey which provides visitor/visit numbers and satisfaction statistics.
For 2018/19, CaRT split its 22 KPI’s into four categories:
♦ Defra Waterway Targets
♦ Waterway measures
♦ Other measures
♦ Financial measures
The ten fails
Whilst not made clear in CaRT’s last annual report (2018/19), the Trust failed to meet almost half of the 22 targets it set itself. The ten fails, compare to seven the previous year (2017/18) and just three the year before that (2016/17).
Worse still for boaters, in the important “waterway measures” category, CaRT failed to meet five out of six targets. The only target it met was that for non boating visitor satisfaction ...
The target failures
The following is a list of the ten KPI’s where CaRT failed to reach target:
Number of individual visitors to our waterways in typical two-week period (over last 12 months)
Public safety—number of reported incidents due to infrastructure
Combined employee, volunteer and contractor RIDDOR accident frequency rating (accidents per 100,000 hours)
Customer satisfaction rating of boaters
№ of days of unplanned closures to navigation within our control (individual instances over 48 hours)
% of employees engaged as per employee engagement survey result
№ of adoptions of our waterways (each adoption scheme roughly equates to 1 mile)
People aware of the Trust
№ of active Friends attracted and retained, regularly donating
£ million secured from restricted statutory and voluntary funding, philanthropic and individual giving and contributions in kind
I will concentrate on just two of the above believing that these are the most important to boaters.
Visitor numbers
CaRT’s claims regarding visitor numbers have received much criticism over the years in narrowboatworld. CaRT does not help itself by sticking to a single measure and the public is given figures in the millions and hundreds of millions with little or no explanation as to why they are so different or where they come from.
Suffice to say, the figures come from a rolling survey which asks participants if they have visited an inland waterway within the last two weeks (it is suggested that if a longer period is used then people tend to forget). Further questioning determines how many times in the two week period they visited.
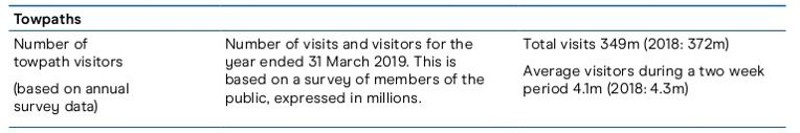
Taking the KPI “Number of individual visitors to our waterways in typical two-week period (over last 12 months)”, CaRT say they achieved 4.1 million visitors last year. This is well down on the target of 4.5million and less than the 4.3 million achieved in 2017/18.
The fact is that, over the last four years, KPI visitor numbers have been in decline. CaRT claimed 4.5 million in 2014/15. Today they give the figure as 4.1 million.
It is even worse with CaRT’s non-KPI figure of the number of visits per year. In 2014/15 the Trust claimed 402 million. It’s 2018/19 annual report shows this has dropped to 349 million.
The reason why this matters to boaters is to do with future funding which government states it wishes to reduce. Unless CaRT can demonstrate that its waterways are providing greater benefit to the general public (i.e. more visitors = more wellbeing = greater benefit), government has little incentive increase its £50 million per year grant when the agreement ends in March 2027. Indeed, it is likely to be reduced or be removed altogether.
Unplanned closures
In 2017/8, CaRT had 490 days lost to unplanned closures missing its target of 400 . For 2018/19 it set itself a target of less than 450 lost days. In the event, it again missed its target suffering 649 lost days.
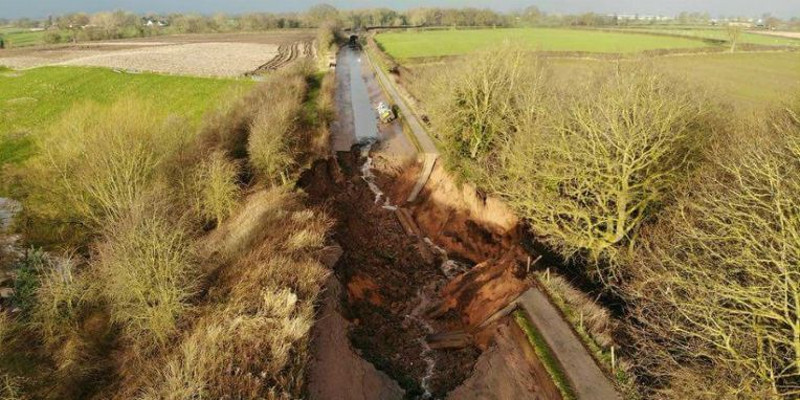
However, reading the small print, the 2018/19 figures it did not include 265 days lost due to vandalism which the Trust claims caused the Middlewich Branch breach. (Pictured.) Likewise it did not include 396 days due to “drought conditions”. These it considered to be outside its control.
Research carried out a year ago indicated that, whilst the number of days lost to unplanned closures has risen year on year, CaRT has changed its “days lost” KPI to exclude certain closures such that it appears that days lost are reducing.
What started out some years back as a simple KPI for the number of days lost to unplanned closures has morphed into “№ of days of unplanned closures to navigation within our control (individual instances over 48 hours)”. That is why CaRT are now so keen to blame vandalism or the weather for its inability to keep its waterways open.
However, with the latest KPI figure, CaRT can no longer keep up this pretence:
No targets for 2019/20
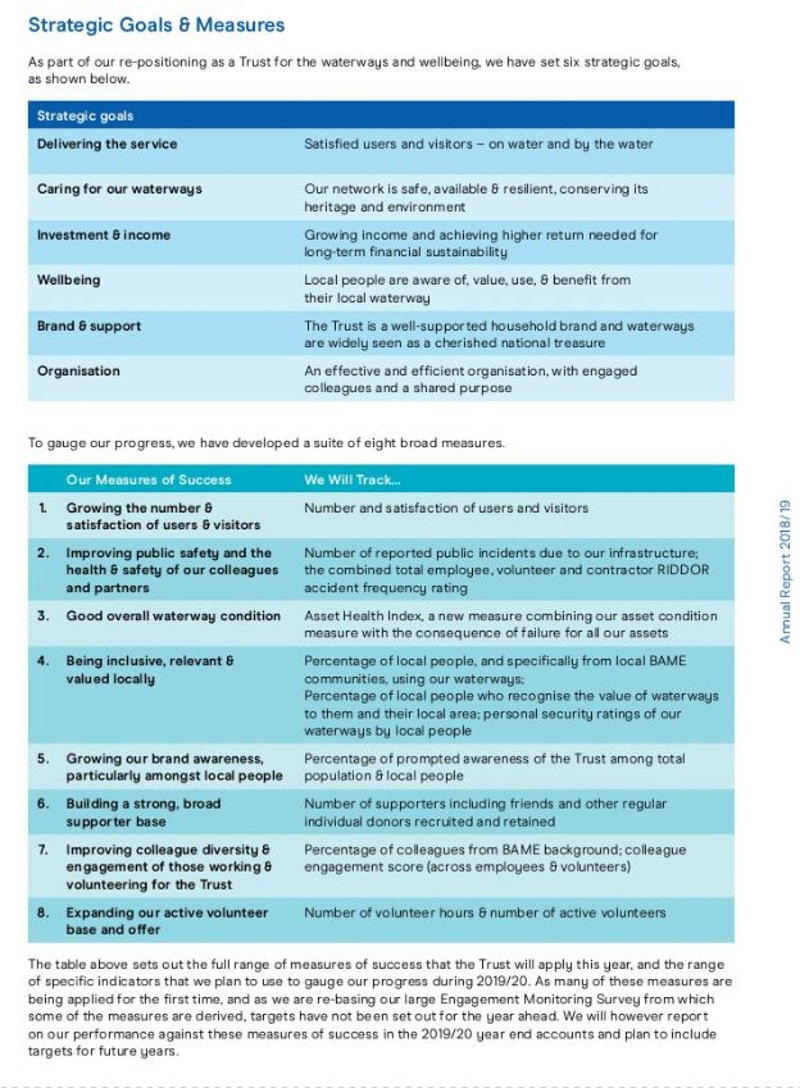
Faced with this declining ability to meet yearly KPI targets, CaRT has has simply scrapped them. Hidden away on page 41 of its latest annual report are some “eight broad measures of success” which will replace the 22 KPI’s.
However, CaRT say these new “measures of success” will have no targets set against them this year.
Obviously, if the Trust does not set itself targets it can not fail to meet them. Likewise, if it changes how it measures its performance, comparisons can not be made with previous years.
Do you get the feeling that CaRT is just changing the way it measures its success and progress to avoid being held accountable for its deteriorating year-on-year performance?
References:
CaRT’s performance against yearly KPI targets are documented in May board minutes (some scrolling will be needed to find them):
(Note: The 2018/19 figures show “Customer satisfaction rating of boaters” as “Outstanding”. The actual figure was later given in the annual report as 61%. This is both a fail against target and down on the previous year.)